Announcing Launch of New Website & Charts!
Highlights
- New Website Application & Fast Crisp Charts
- New Email Newsletter Subscription and Website Articles
- Under the Hood of the New Website: Sveltekit and D3 Charts
Table of Contents
- New Website Introduction
- Chart Boards
- What’s Under the Hood & Why?
- About & FAQ
- Subscribe to the Newsletter
New Website Introduction
- Brand New Look & Feel
- Email Newsletter Subscription
- Website Article Collection & Category Group Grabs
Welcome to the totally revamped BALANCE Website & Application!
We have been deep in the weeds working on this totally bespoke website for many months, and are very excited to finally share what’s new.
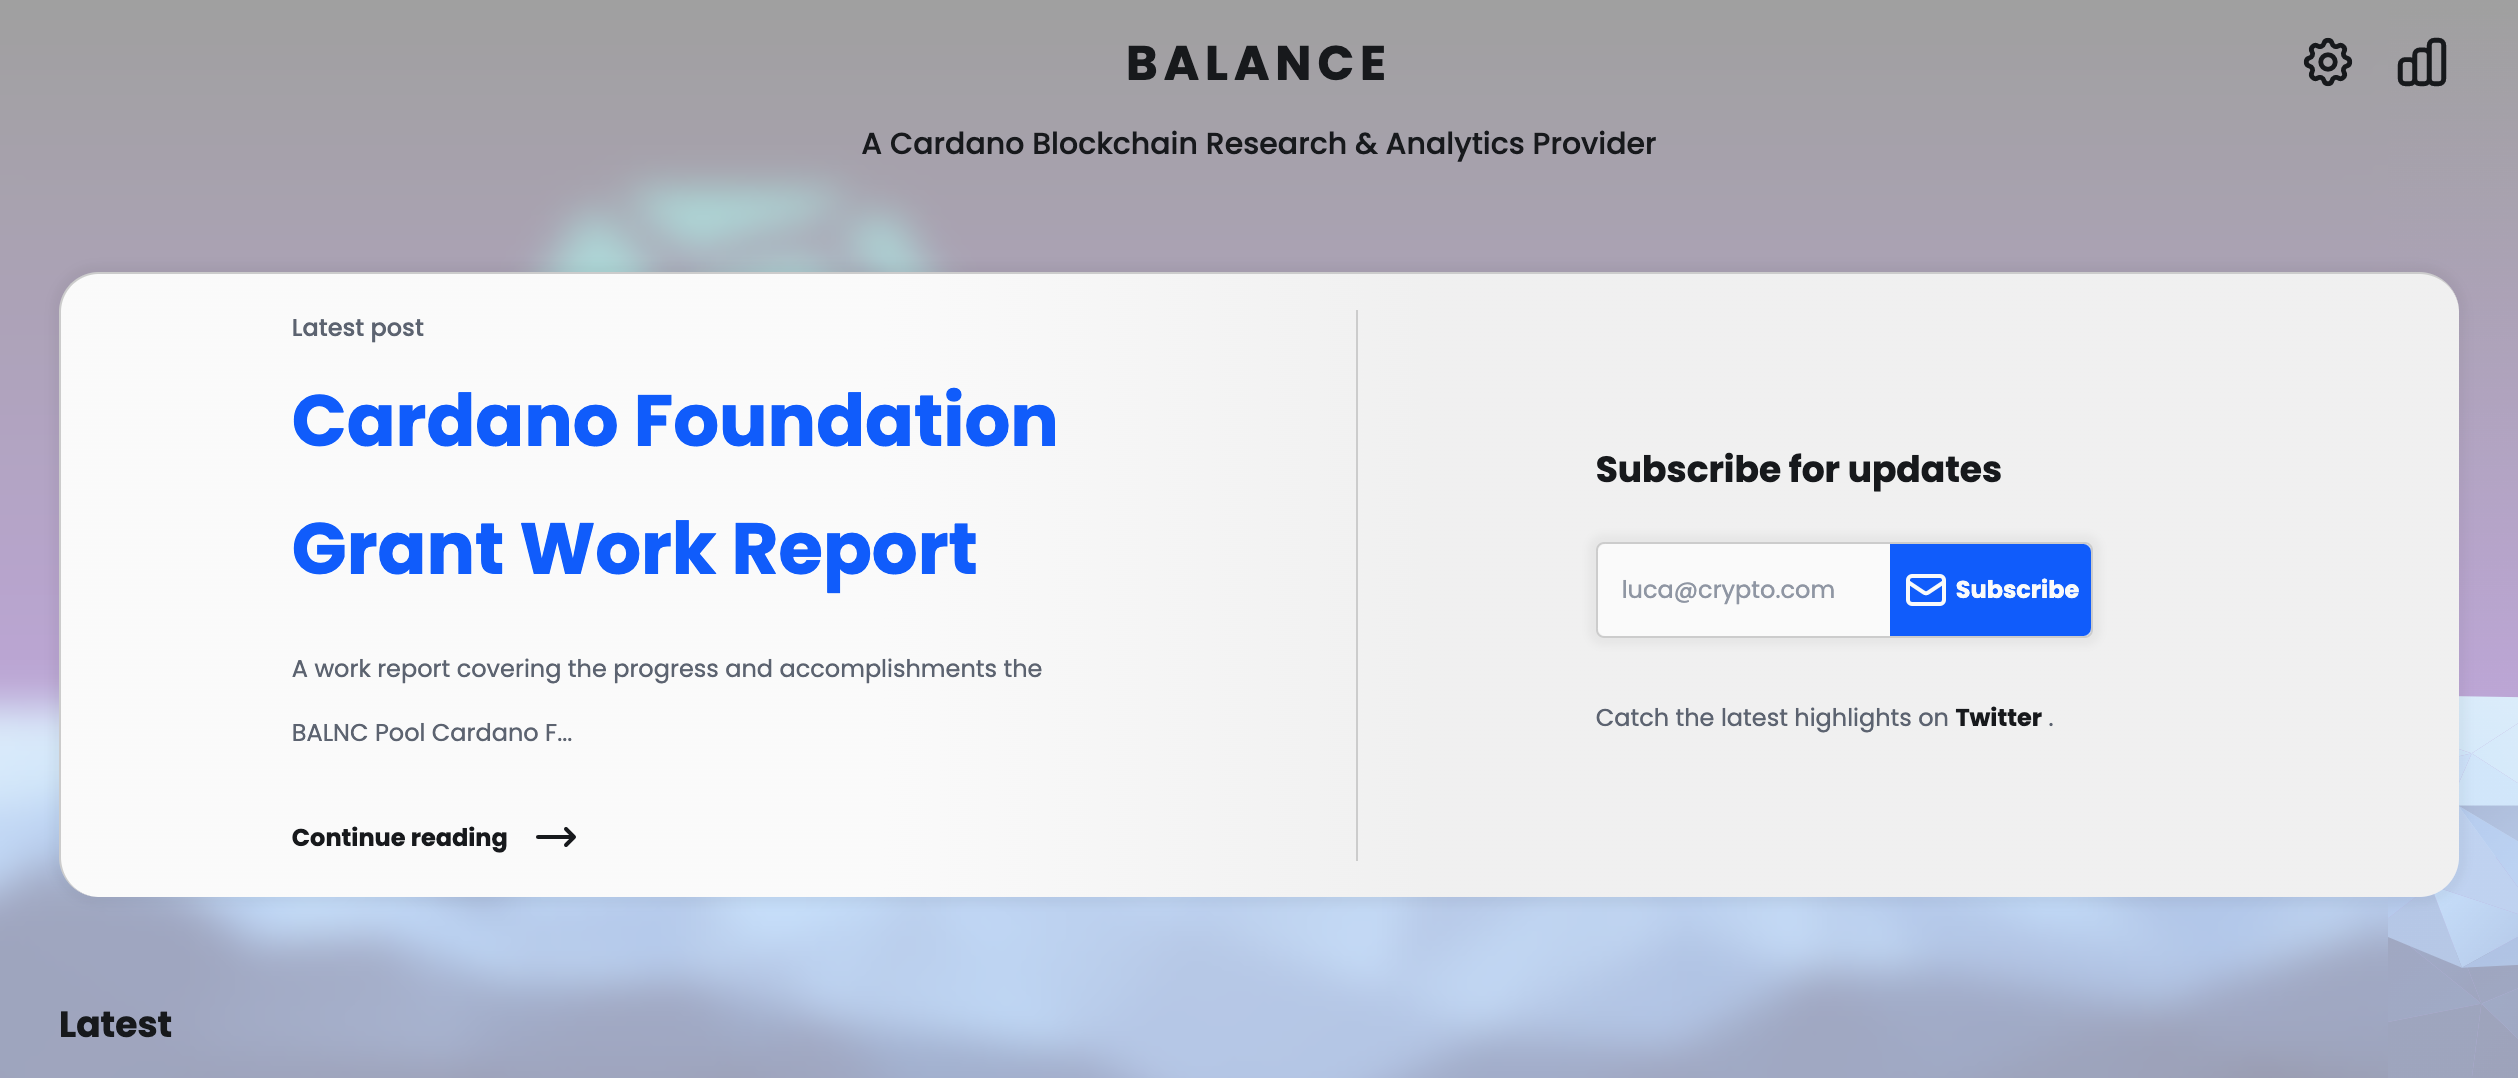
Before jumping into the “why” and the technicals, first a quick tour:
Email Newsletter Subscription Service: You are greeted with an email newsletter subscription as soon as you land on the homepage. We will start bringing Cardano research and analytics right to your inbox.
Website Article Library: If you miss an email, there will be a full library of articles to browse from the homepage. Articles will range from pool group and landscape deep dives, to development updates, education, and tutorials.
Light and Dark Mode: Check out the new BALANCE Dark Mode vibes, perfect to get lost in blockchain deep dives. You can also adjust font parameters.
Grab Articles by Category: At the website footer are article category tags to choose from for certain topics of interest. You will then be taken back to the homepage with the queried articles of interest.
Research Articles: We aim for highly curated research and analysis in our articles. At the bottom of our shareable articles are calls to action to delegate, subscribe, and join our chat in the Matrix — our intelligence hub community.
Chart Boards
- Fast Big Data Loading on Beautiful Info Dense Charts
- Crisp and Responsive Chart Interaction
- Beautiful Transitions and Exploratory Tools
BALANCE is way more than a Website, it’s a full blown Application. Let’s see why.
Here is the Chart Board in the updated Light and Dark Mode themes. Note how quickly these charts load. This is pretty amazing given the big data information density distilled in the charts.
Presenting the Average Resulting Decentralization Chart where you can see the 51% pool network metric over time in a new pretty presentation.
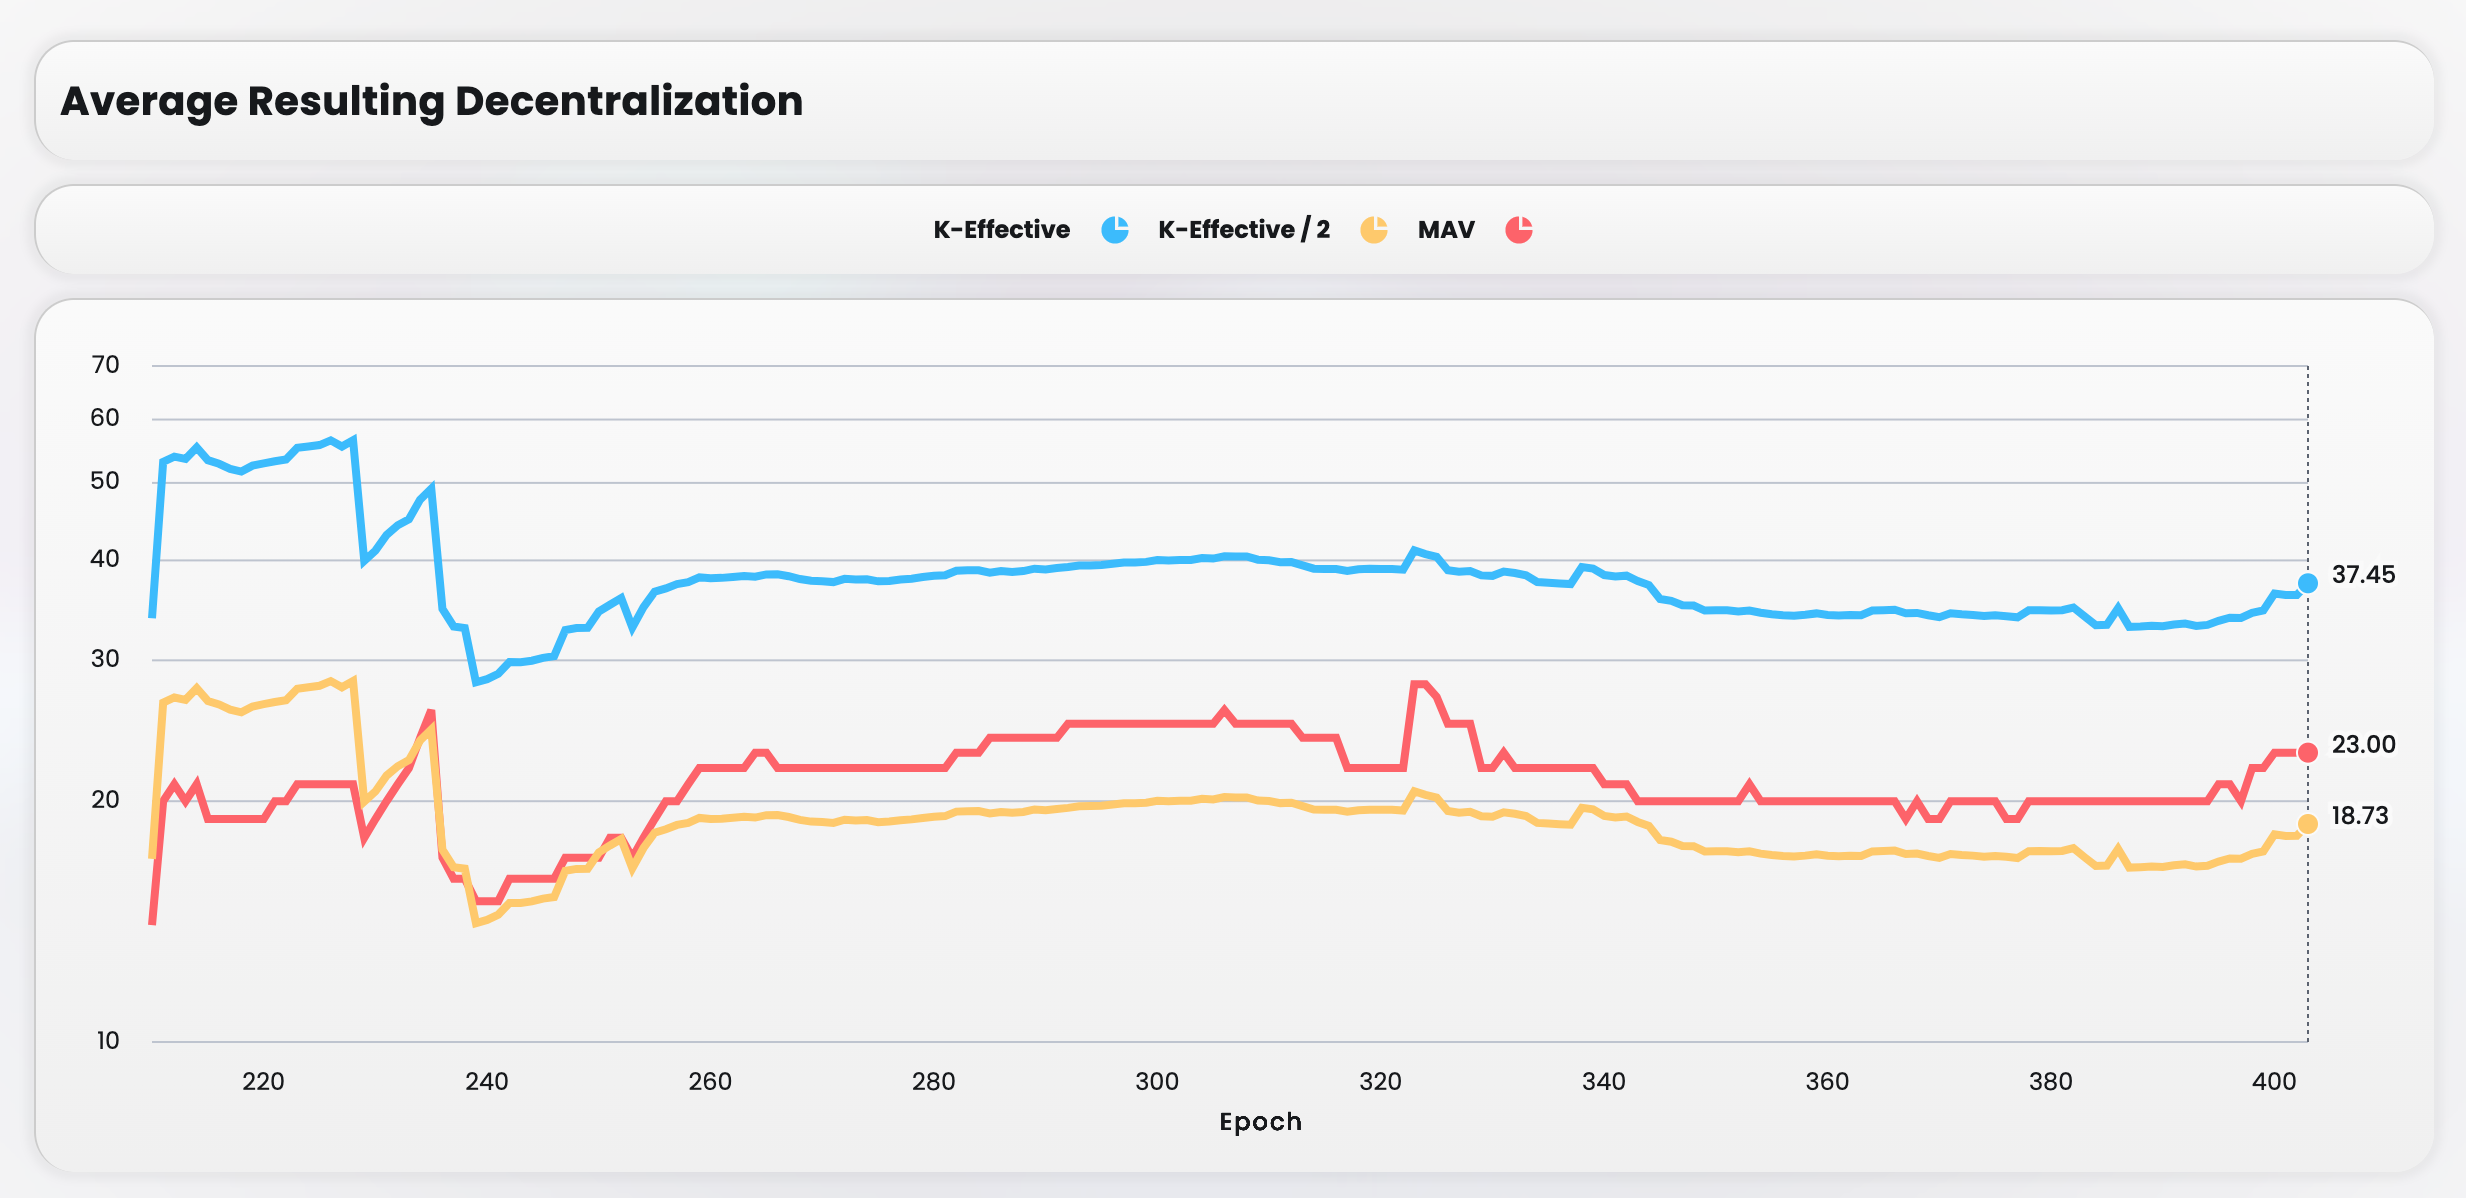
However, the real magic is the chart’s interaction and crisp responsiveness. This makes data exploration a much more satisfying and enjoyable experience.
Next, presenting the infamous Group Stake Vs Leverage Chart. It’s a beautiful information dense visualization.
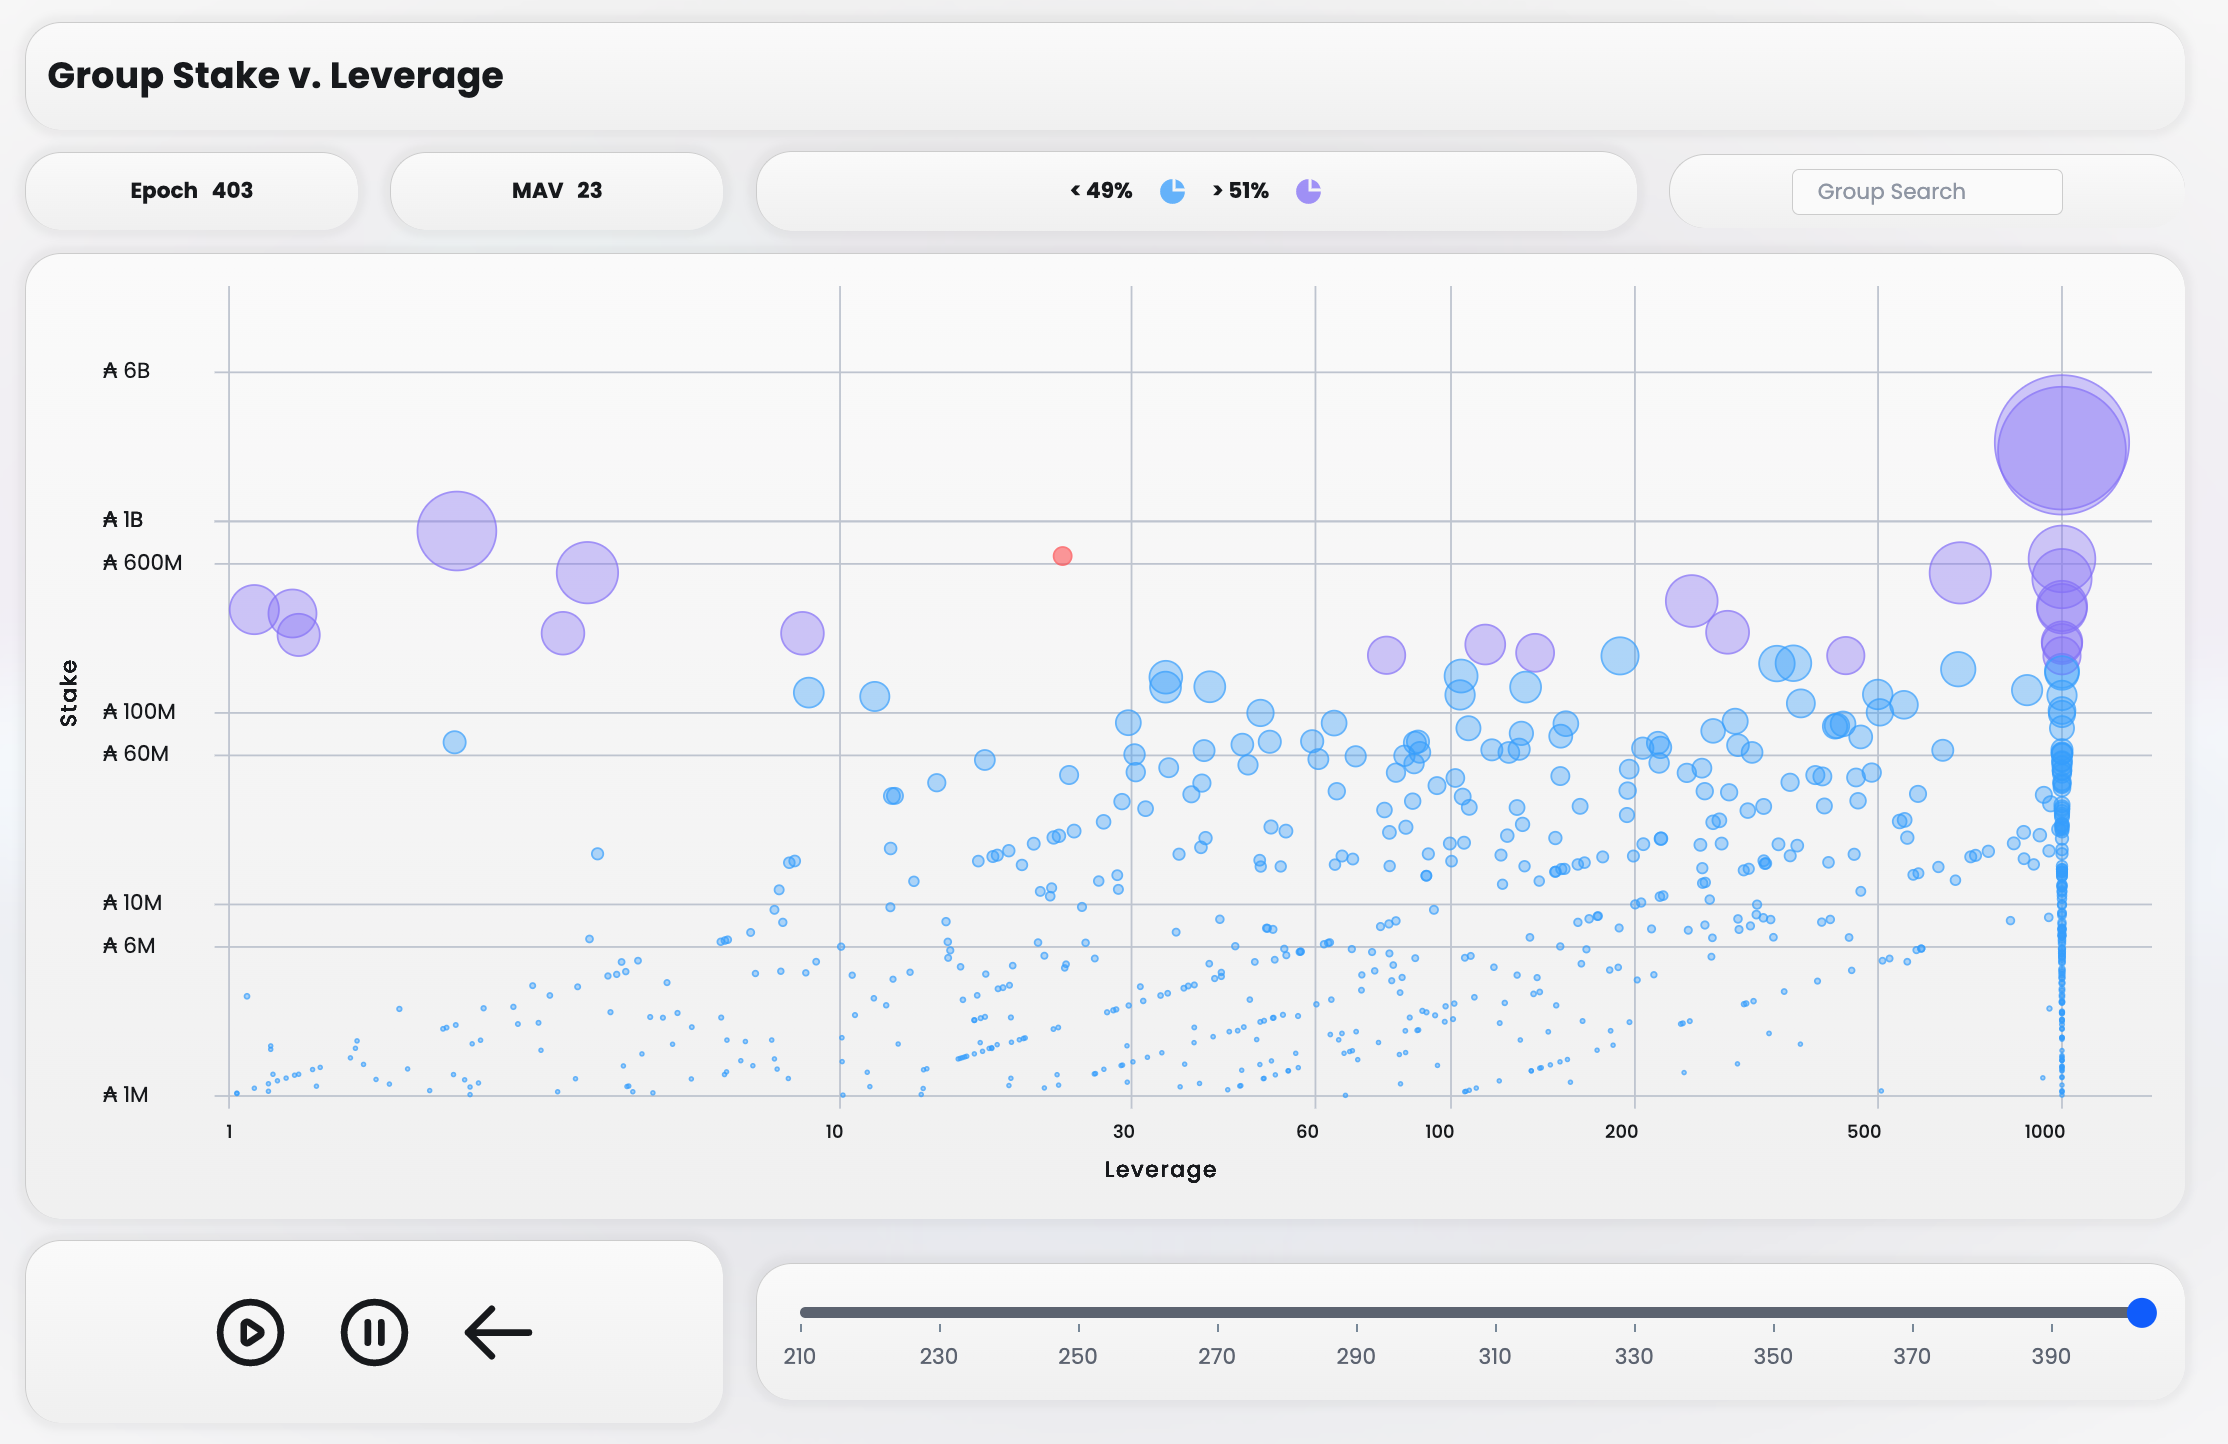
However, the true beauty now is in the data exploration. The Hover Tool Tip has smooth transitions and almost no lag. Skipping over the pools with the data tip is fun.
Probably something we are most proud of with the new tech stack is the sheer responsiveness of the charts given all the big data behind the scenes. The Time Tool Strip allows you to see Cardano’s Stake Pool Landscape over time (epochs) and catch the trends you might never have picked up on before just looking at tables numbers.
Press play, sit back and enjoy the show. Pause to explore.
Something you’re going to love, a brand new feature called Pool Search. Find your pool (or group) and follow its progression.
What’s Under the Hood & Why?
- Sveltkit & D3 Charts
- Solid Foundation on Bedrock Ready for Building
Why go thru this effort? The old BALANCE Web App was built on React and Javascript framework and it just couldn’t handle the information dense charts. It was very obvious the site took forever to load and the charts were very laggy to explore. For the best Cardano data analytics and with plans for much more data and charts, we took a fresh look at the website’s foundation. Could it handle the big data work load and could it take increased future growth? Probably not…enter SvelteKit.
Sveltekit for the Website & Application
We took a step back and performed a trade study of what tech stack or architecture would be a solid foundation to build upon, be future proof, and meet our design needs. That led us to Svelte.
Svelte is a new framework and language that has the significant advantages of a fast, clean, and crisp user experience that far out-weighs its predecessor of React and Javascript.
From the Svelte website:
“Svelte is a radical new approach to building user interfaces. Whereas traditional frameworks like React and Vue do the bulk of their work in the browser, Svelte shifts that work into a compile step that happens when you build your app. Instead of using techniques like virtual DOM diffing, Svelte writes code that surgically updates the DOM when the state of your app changes.”
Basically, running Svelte at build-time compiles your code into lightweight, super simple and efficient javascript code chunks, thus the user gets a fast experience. The heavy lifting is done at compile time instead of on-demand in browser time.
Svelte would be great for just the website, but for the Web App we needed to go one step further with Sveltekit.
“SvelteKit is a framework for rapidly developing robust, performant web applications using Svelte…Svelte renders UI components. You can compose these components and render an entire page with just Svelte, but you need more than just Svelte to write an entire app. SvelteKit provides basic functionality like a router — which updates the UI when a link is clicked — and server-side rendering (SSR).”
So Sveltekit is the tooling and framework that lets you build a Web App using Svelte (and other stuff), including the server-client side fetch and push interactions, shared memory, and full stack capabilities.
Sveltekit is a hot new language that is being adopted for good reason, but it is still very new, has poor documentation at times, and has early growing pains.
D3.js for Beautiful Charts
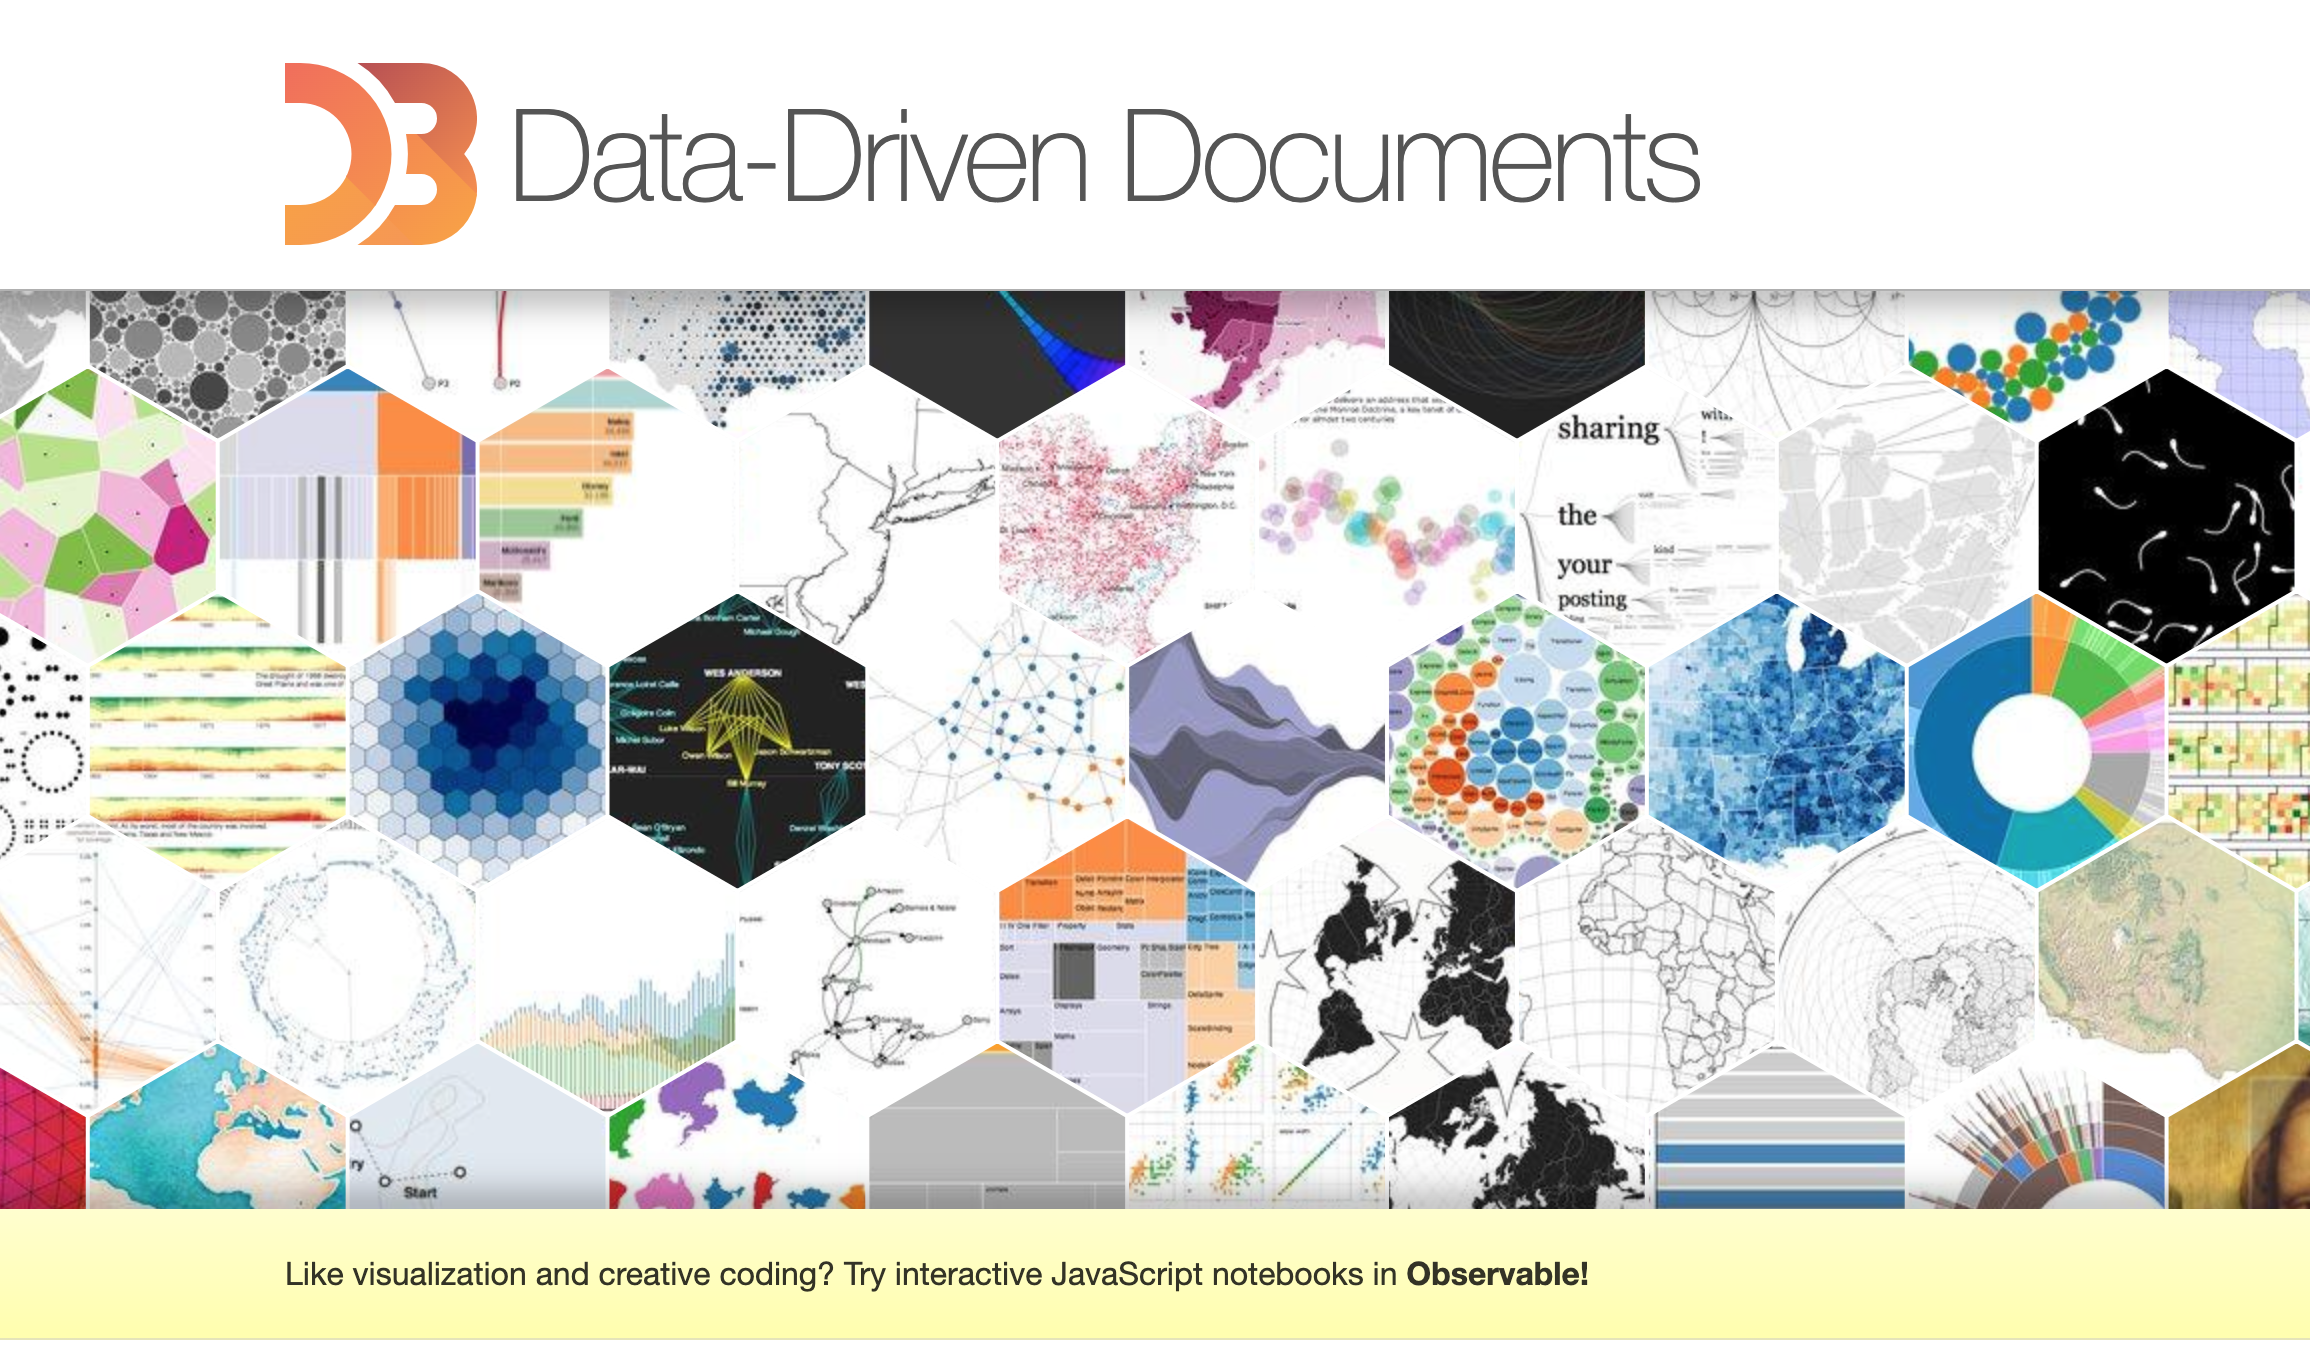
Ultimately, to make serious professional grade charts and curated data visualizations, we needed a robust and extensive library that is compatible with Sveltekit. That ultimately lead us to D3.
From the D3.js website:
“D3.js is a JavaScript library for manipulating documents based on data. D3 helps you bring data to life using HTML, SVG, and CSS. D3’s emphasis on web standards gives you the full capabilities of modern browsers without tying yourself to a proprietary framework, combining powerful visualization components and a data-driven approach to DOM manipulation.”
D3 is a robust and mature Javascript visualization library used by the dataviz pros, with the trade off of complexity for additional control and artistic work. After browsing what is possible from the very creators of Sveltekit showcasing their data visualization story telling, it is very impressive and BALANCE was sold.
Finally, the bedrock is laid. It should be clear by now BALANCE is going for timeless, high quality work. The design decision to use Svelte was not the easy route, but we believe the right design decision for a bedrock foundation to build upon.
About & FAQ
- FAQ Expanding Boxes, Beautiful and Info Dense
- About Page
Thanks to SvelteKit’s smooth transitions and design, the FAQ section is info dense yet easy on the eyes. Come here for any questions, which we’re sure there will be many.
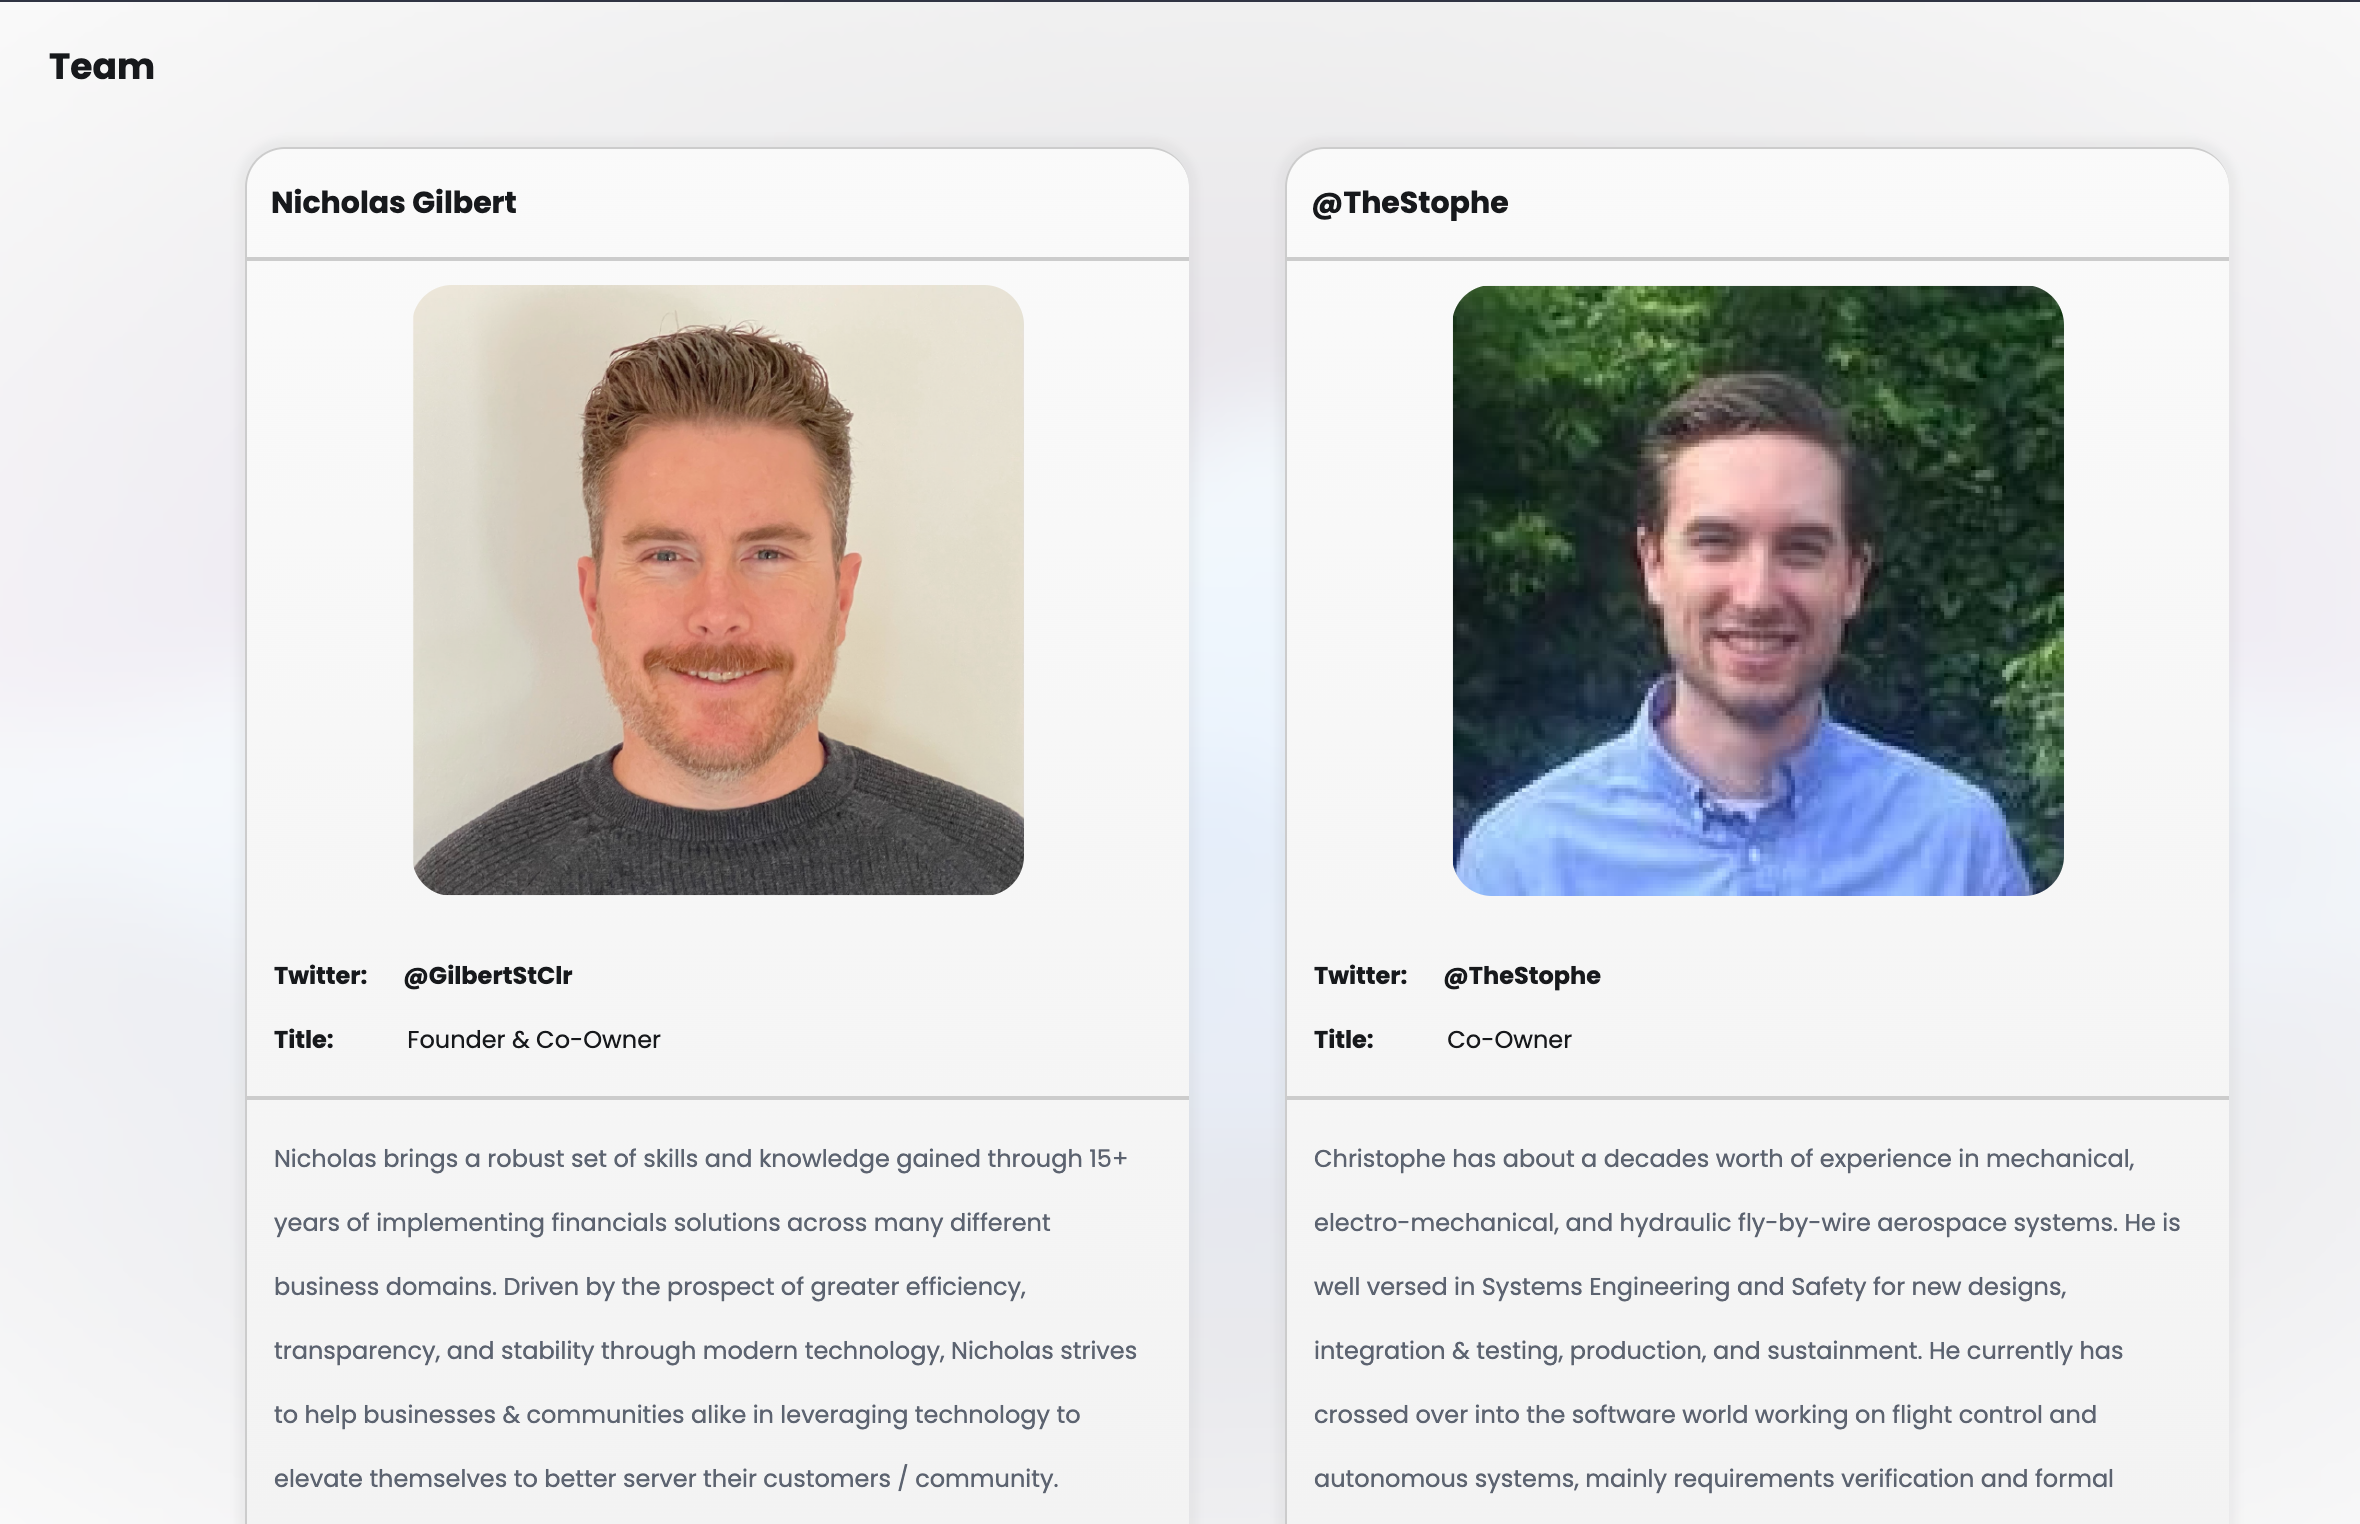
Here’s the team behind BALANCE that is hard at work for your Ada delegation. We have a pretty rich and diverse experience combination which should give us a unique perspective aside from reliable work ethic and technical capabilities.
Subscribe to the Newsletter
That’s all for now, thanks for reading! Subscribe for more updates to come as we continue to build out more charts, research, analysis, data stack, roadmap, tutorials, and more.
Have feedback, want to request some charts? Please jump in our Matrix Space or find us on Twitter.
If you would like to support future research and blockchain analytics, please consider delegating to Balance Stake Pool - [BALNC].
Join the BALANCE Matrix server to get involved and meet the team. Stop by today to help build a more resilient blockchain network.
Join BALANCE Matrix Server