Cardano Foundation Grant Work Report
Highlights
- New Website and Fast, Crisp Charts
- New Email Newsletter Subscription and Website Articles
- Work completed, design ethos and decisions
- Roadmap and look-ahead
Table of Contents
Show of Appreciation
The Cardano Foundation (CF) Delegation Grant is a huge sign of appreciation and support of BALANCE’s core mission and work, namely decentralization metrics and pool group tracking for Cardano insights. The CF Grant and support from the greater Cardano Community at large has really validated that our work and passion at BALANCE is valuable. The Grant has sparked and reinvigorated our focus and work. We now want to take our charts and analysis for Cardano to the next level!
Therefore, this report captures our updates, work accomplished so far, and our roadmap planning look-ahead. Get ready!
Updates
New Website and Fast, Crisp Charts
The BALANCE website and charts are being revamped for a fast and crisp big data experience! On our old site, the Stake Vs Leverage Chart loading was so slow because there was so much big data to load. Also, the interactive experience was sluggish and laggy.
Not anymore! BALANCE has decided to totally revamp the website design to be fast, crisp, and look great.
New Email Newsletter Subscription and Website Articles
What good is analysis if it’s not in your hands? The BALANCE Website will now have an email newsletter subscription for our Cardano insights! The newsletter articles will link back to the website to our article library.
Work Accomplished
New Bespoke Website & Application Development
After months of hard work, BALANCE is proud to announce the eminent launch of our brand new bespoke website!
The website will be complete with an email newsletter subscriptio, article library, and most importantly our curated chart boards.
The real reason to renovate and clean house on the old website was to tackle the problem of how to create beautiful charts and analysis that are also a great user experience of being fast, responsive, crisp, and exploratory.
We explored different open source frameworks and libraries that would position us to have the best chart experience, quality, and future proof advantage.
Ultimately, after an extensive trade study was performed exploring the solution space, the design decision was made to pursue a Sveltekit Web-App with D3.js Charts combo.
Though this design decision carried significant hard work, learning curve, and schedule impacts, the fundamental quality and performance under the hood was the driving decision factor to create a product that will last for years to come.
The Cardano culture is no stranger to these difficult design decisions based on principles and design ethos. This is akin to choosing Haskell for the Cardano-Node.
But alas! The hard work and up front design was worth it in our opinion. The visual appeal and crisp feel of the charts will have an amazing exploratory experience and valuable data insights. Here’s a preview of our Group Stake Vs Leverage Chart:
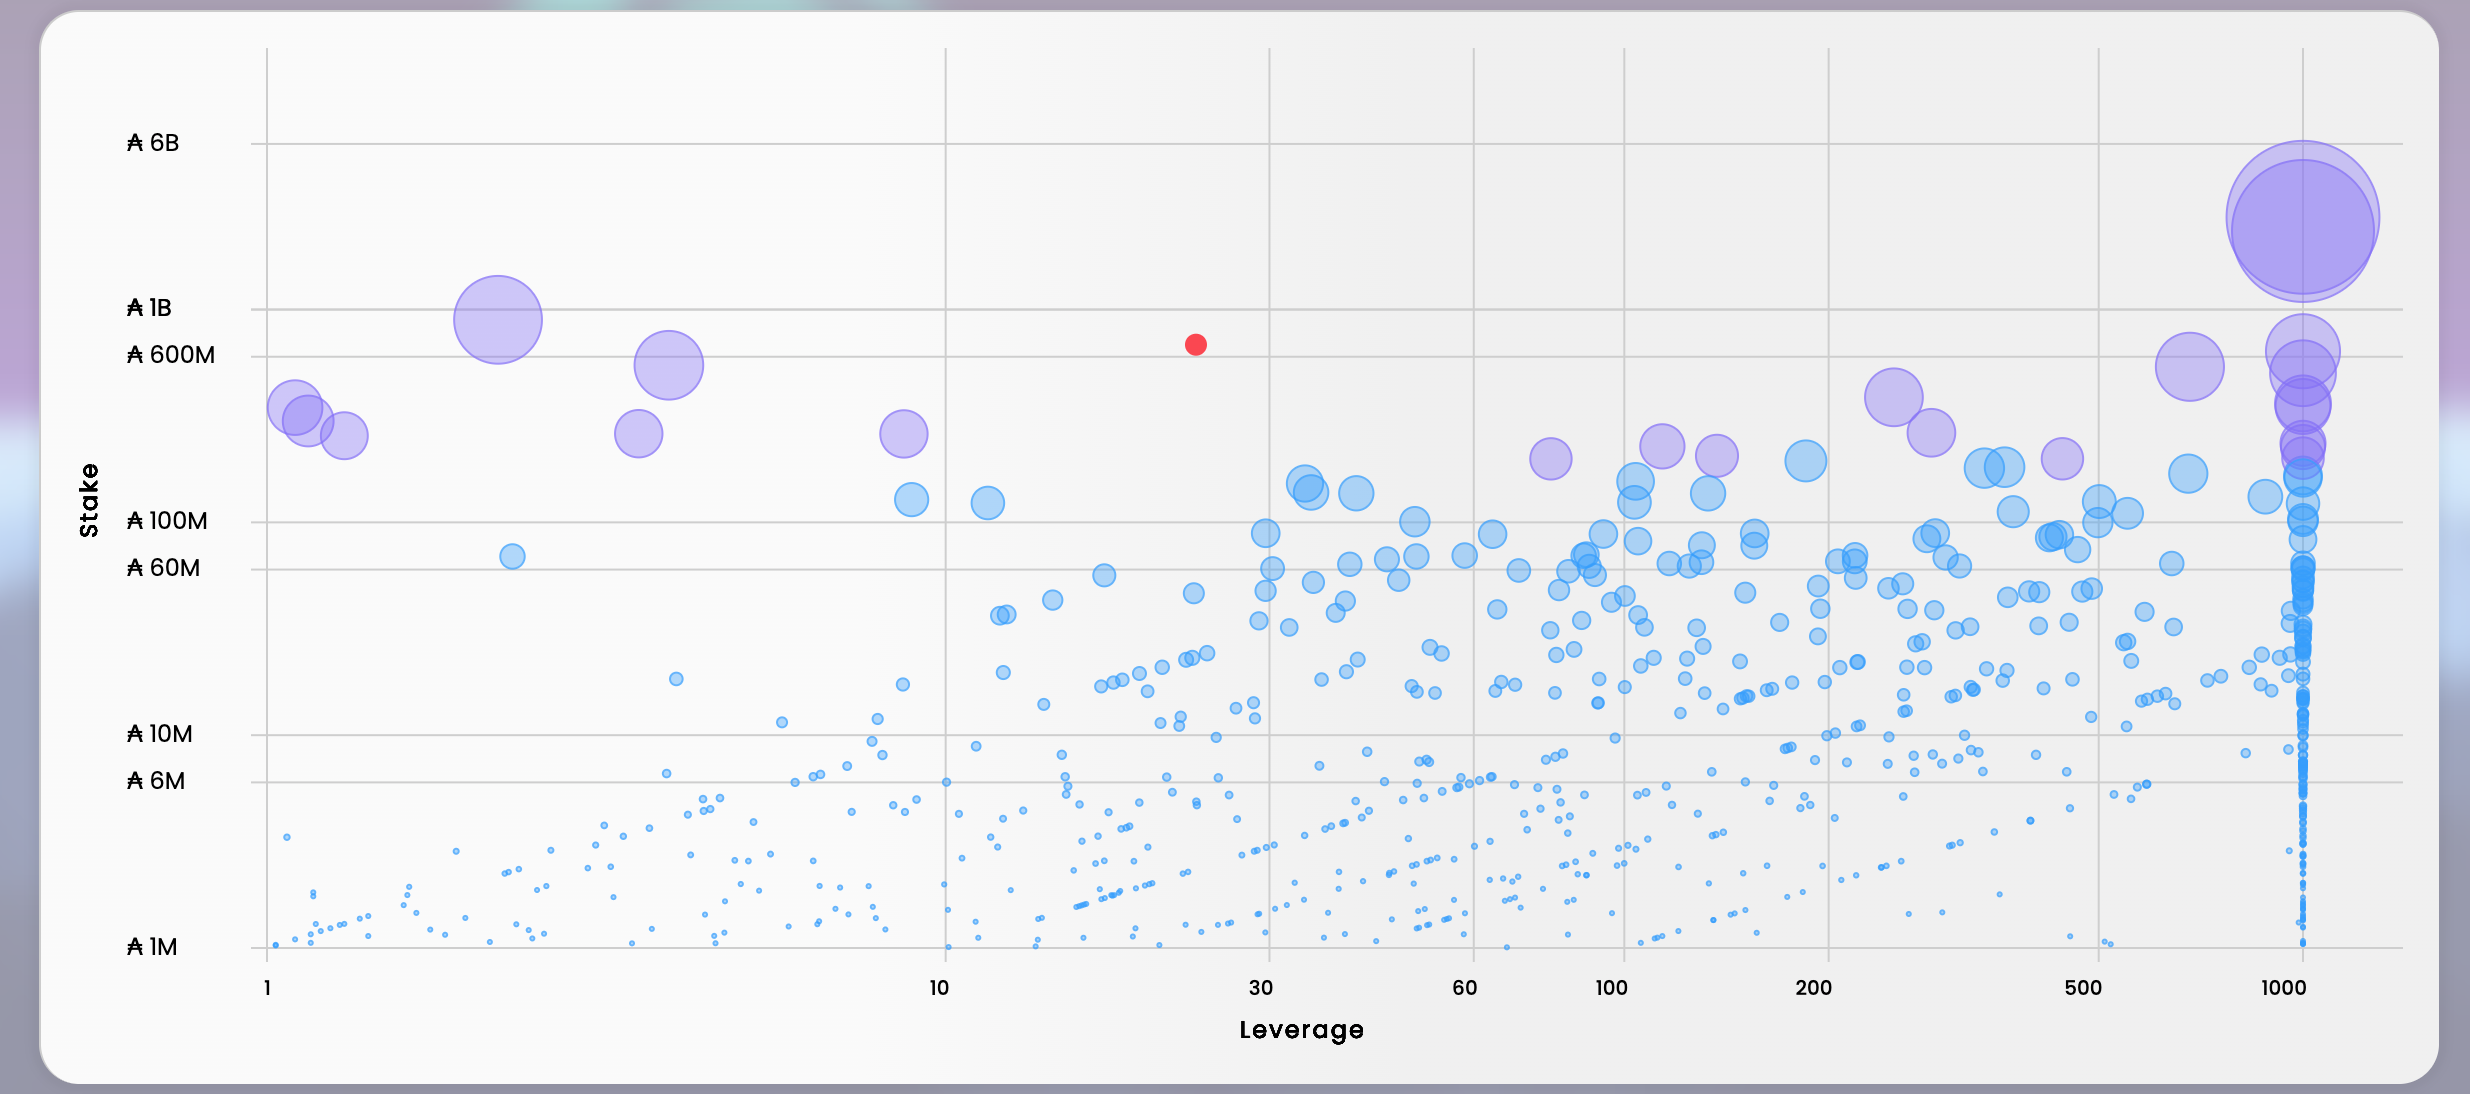
Please explore and play with the CIP-50 Charts for the full experience.
Why Sveltekit for the Website & Application?
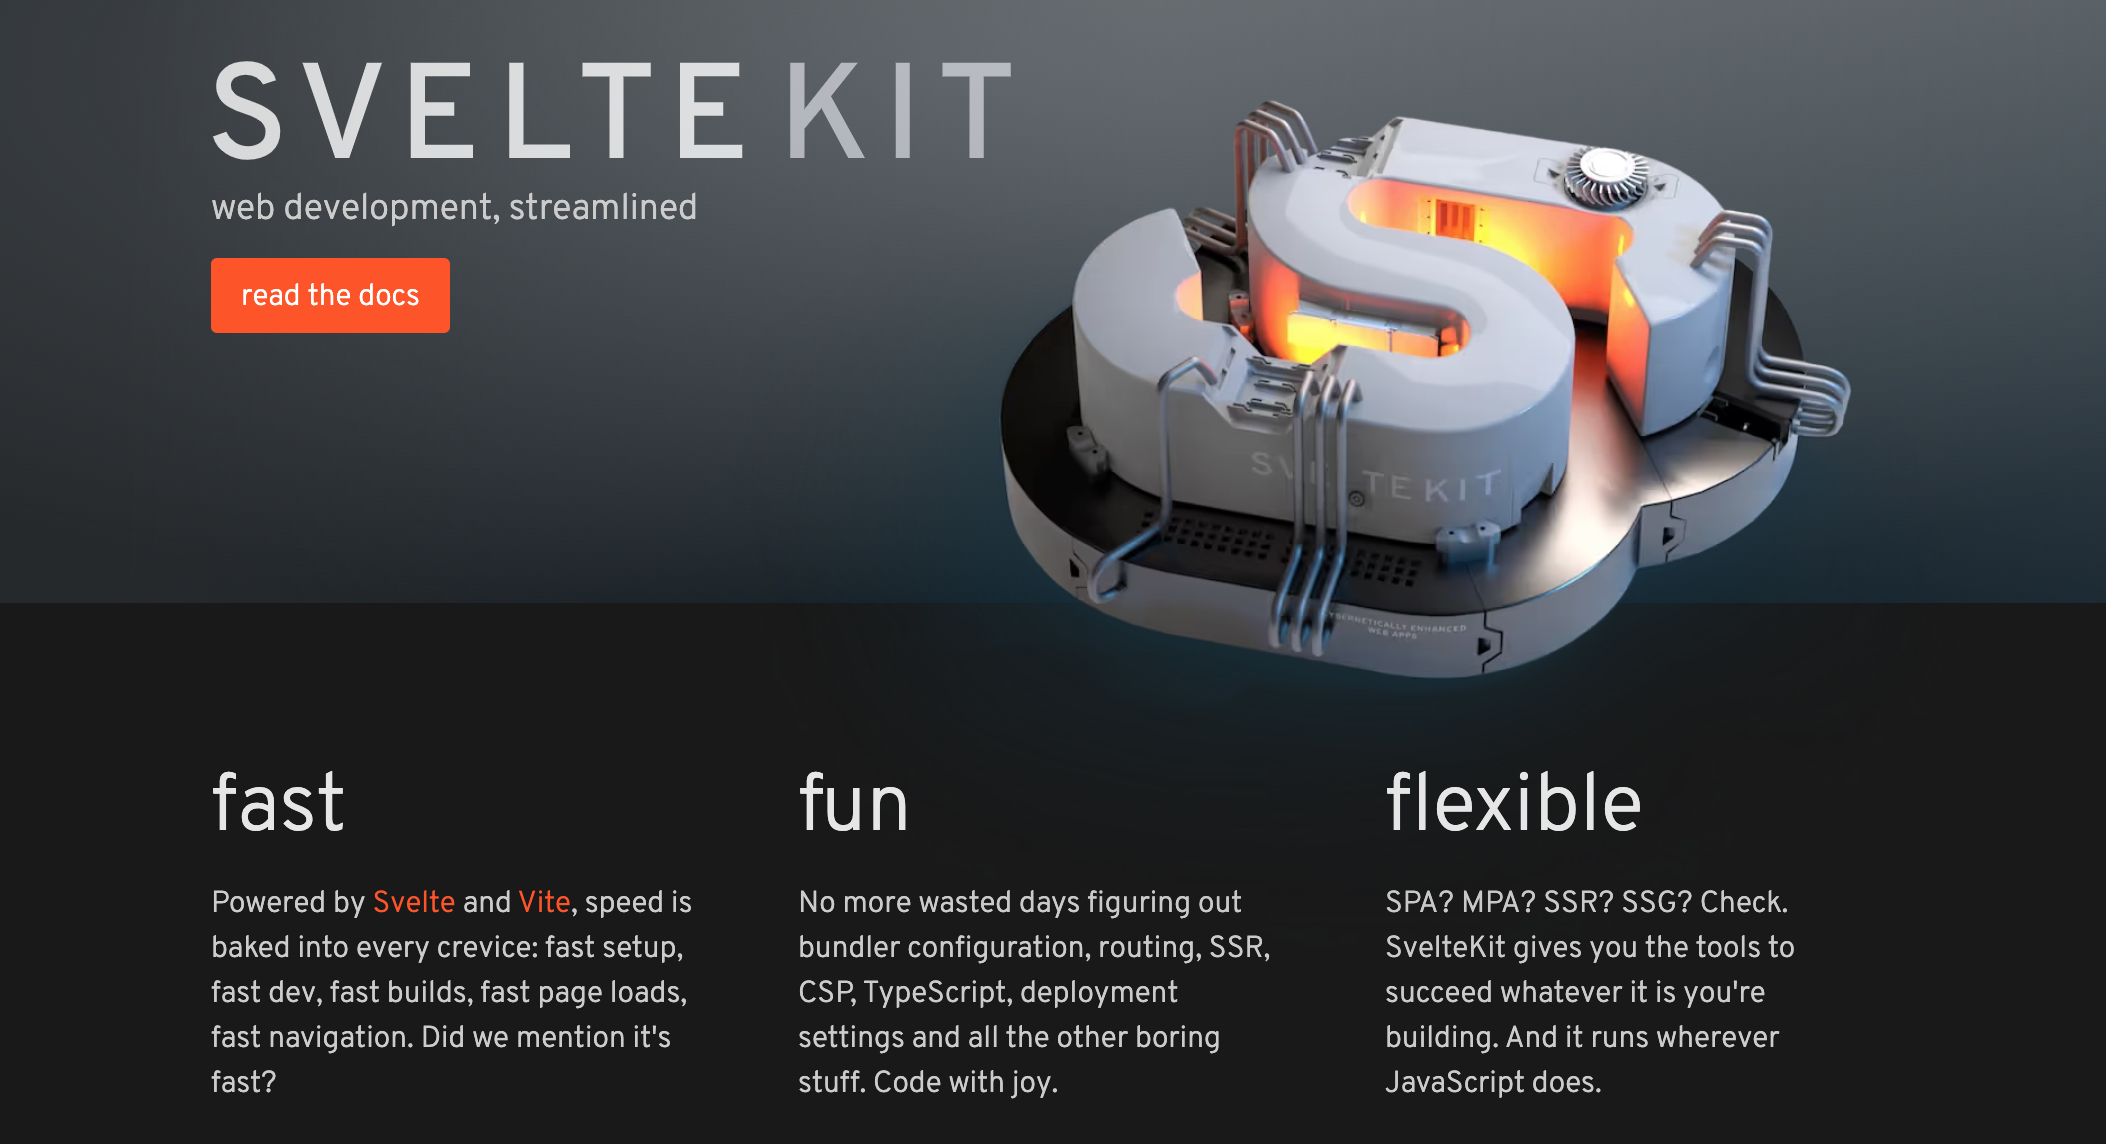
Basically, Svelte is a new framework and language that has the significant advantages of a fast, clean, and crisp user experience that far out-weighs its predecessor of React and Javascript.
From the Svelte website:
“Svelte is a radical new approach to building user interfaces. Whereas traditional frameworks like React and Vue do the bulk of their work in the browser, Svelte shifts that work into a compile step that happens when you build your app. Instead of using techniques like virtual DOM diffing, Svelte writes code that surgically updates the DOM when the state of your app changes.”
In layman’s terms, running Svelte at build-time compiles your code into lightweight and super simple javascript code, thus the user gets a fast experience. The heavy lifting is done at compile time instead of on-demand in browser time.
But what is Sveltekit? Above was about Svelte
Very observant, glad you asked. From the Sveltekit Introduction:
“SvelteKit is a framework for rapidly developing robust, performant web applications using Svelte.” “Svelte renders UI components. You can compose these components and render an entire page with just Svelte, but you need more than just Svelte to write an entire app. SvelteKit provides basic functionality like a router — which updates the UI when a link is clicked — and server-side rendering (SSR).”
In layman’s terms again, Sveltekit is the tooling and framework that lets you build a web app using Svelte (and other stuff), including the server-client side fetch and push interactions, shared memory, and full stack capabilities.
Sveltekit is a hot new language that is being adopted for good reason, but it is still very new, has poor documentation at times, and has early growing pains. So, the design decision to use Svelte was not the easy route, but we believe the right decision.
Why D3.js Charts?
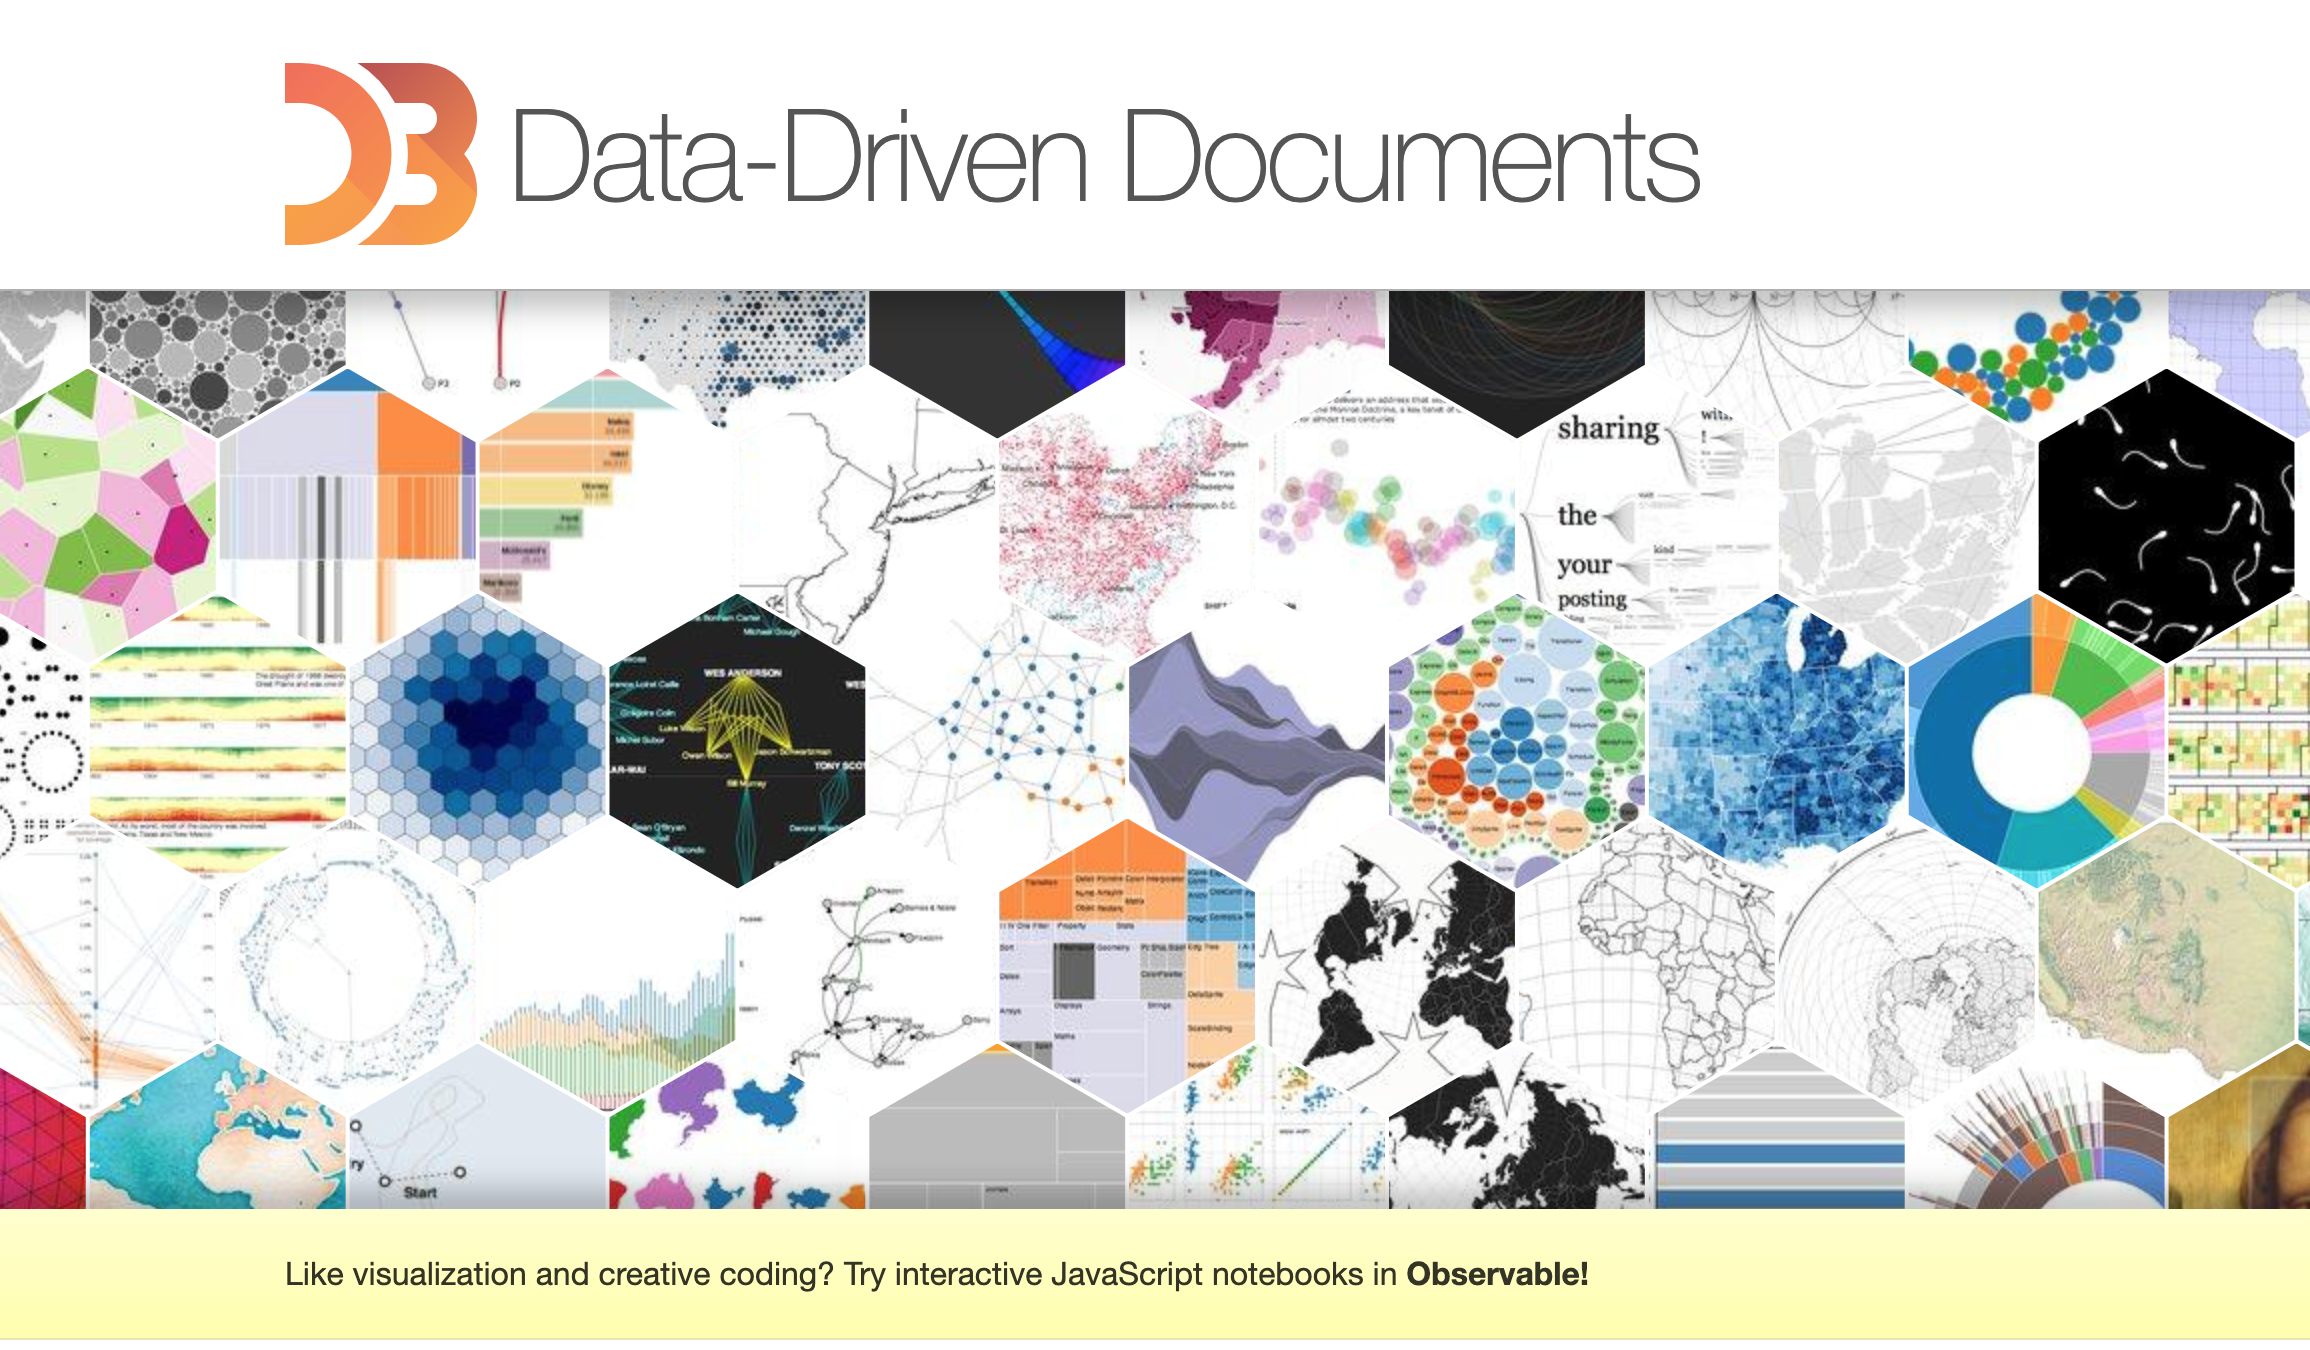
Ultimately, to make serious, professional grade charts and curated data visualizations, we needed a robust and extensive library that is compatible with Sveltekit. That ultimately lead us to D3.
What is D3 you ask?
Well, from the D3.js website:
“D3.js is a JavaScript library for manipulating documents based on data. D3 helps you bring data to life using HTML, SVG, and CSS. D3’s emphasis on web standards gives you the full capabilities of modern browsers without tying yourself to a proprietary framework, combining powerful visualization components and a data-driven approach to DOM manipulation.”
In layman’s terms, D3 is a robust and mature Javascript visualization library used by the dataviz pros, with the trade off of complexity for additional control and artistic work. After browsing what is possible from the very creators of Sveltekit showcasing their data visualization story telling, it is very impressive and BALANCE was sold.
It should be clear by now BALANCE is going for timeless work and the learning curve investment is worth our time for quality.
Website Email Newsletter Subscription and Articles
Aside from awesome charts, we want analysis to go into the Community’s hands. Therefore we are starting up an email newsletter integrated into the website using Buttondown.email.
We are sold on Buttondown after reviewing the market because it’s a grassroots grown project built by a talented founder Justin who maintains it. The service was built for customization control, integration, low overhead, and simply send email very well. It’s a great fit and allows easy workflow with the website articles written in Markdown to be used for emails as well.
The newsletter and article topics covered will be mainly stake pool groupings, pool landscape changes, and BALNC pool updates. Cardano blockchain intelligence will come right to your inbox and be available to read in bulk on the website. We are looking to provide pool update articles weekly, and big picture deep dive Cardano reports monthly.
We will be utilizing heavily SQL and db-sync to support our on-chain data analysis, which should yield amazing insights as we grow our analysis footholds.
Listed on Cardano Developer Portal & Single Pool Alliance
In addition to website development heads down in the trenches, in parallel we have socialized a bit to get the BALNCE name out there and recognized.
We have been successfully listed in the Cardano Developer Portal and the Cardano Single Pool Alliance.
We’ve also update our website with an About Page on the Founder and Team. Once our initial website building is ready for public release, we’ll be more active on social medias too.
As you can tell, the CF Grant Delegation has been put to hard work, and we hope the results speak for itself from the CIP-50 Chart Board, Web App experience, and Newsletter service.
Roadmap
So, with continued CF Grant support how would BALANCE use it?
Well, we have big plans. If our CF Grant support stays for the next delegation round, as well as the support from our loyal delegators, it will fund the following work:
Phase II: Website & Community Building
By creating and delivering on our public intelligence services, we hope to exchange value-for-value and gain BALNC stake pool delegators to sustain our work and mission.
Continued Website Building: Currently the website is a Minimal Viable Product. We already have Phase II improvements tagged and are still learning what’s possible in Sveltkit website development. We still need to expand our Pool Specs page and quick page searching. This is only the beginning.
More Charts: We have a ton more ideas for insightful and highly curated chart boards. Topics include not only the stake pool grouping and landscape realm, but also anything curious on-chain regarding network health, wallets and rewards. There’s so much potential and no shortage of ideas, the only problems will be focus and time. We’ll start with easy essential stuff, like Donut Charts and expand out.
Building a Newsletter & Intelligence Community: We also want to curate an analysis and intelligence community hub, brand, and become the goto for watchdog tips from the community.
We’ll start with providing weekly pool landscape updates, tutorials, and monthly reports in our email newsletters and website articles. As our SQL scripting and db-sync library grows, so will the breadth and depth of our analysis. We’ll gain a strong technical foothold and reporting operating rhythm. We’ll start to standardize our metrics and provide reliable stake pool change updates weekly, and deeper dive on network analysis reports monthly.
Aside from supporting Cardano network decentralization with the BALNC stake pool and high pledge, BALANCE is also one of the first (like first three) Cardano Stake Pools to support communication decentralization too.
BALANCE runs a self hosted Synapse server to support a Matrix.org Space. Matrix.org describes itself as “an open network for secure, decentralized communication” and has an amazing ecosystem and growing roadmap. Matrix Spaces are an end-to-end encrypted chat, like Signal Messaging App meets Discord meets home server networks.
Imagine all Cardano Stake Pools hosting decentralized communication in parallel to running full peer-to-peer Cardano nodes. BALANCE is spear heading the comms front. Ask us for a BALANCE profile server_name and join our BALANCE Matrix Space (we recommend the Element App).
From the newsletters and social media we’ll encourage folks to join our Matrix Space for insightful discussions, questions, and chatting. We’ll look to foster a decentralized analytics ecosystem, provide early insight here, tutorials, help, and education.
New Social Media Presence: Doing heads down work is our favorite thing to do, but we’ll be stepping out of our hole and increasing our social media presence shortly. We’ll look to inform the community with key intelligence daily, as well as receive open source tips to investigate. This will not only strengthen our watchdog presence, but also provide more robust publicly available data and insights.
Phase III+: Business Development & Growth Planning: Once the BALNC pool grows and the BALANCE website content and brand matures, BALANCE’s ultimate goal is to expand into the Data-as-a-Service business model.
There are many untapped ideas since BALANCE has the entire db-sync blockchain on baremetal (not just an index), and a unique set of data infrastructure skills.
One possible avenue could be to provide on-chain data to wallets, curated charts, or any project that needs data. We may also explore Delegation-as-a-Service where the high end intelligence value is only provided to the stake pool delegators. We could also create tutorials or educational courses for small group education or pool delegates. This may attract others who wish to learn and build a learning and teaching culture within the pool’s Matrix Space.
What’s Possible? An Overview
So is this Sveltekit, D3, and curated dataviz analysis over hyped? Well, if you’ll indulge, here is what’s possible:
Below is an example of a simple D3 pie chart that has a tooltip to explore each section:
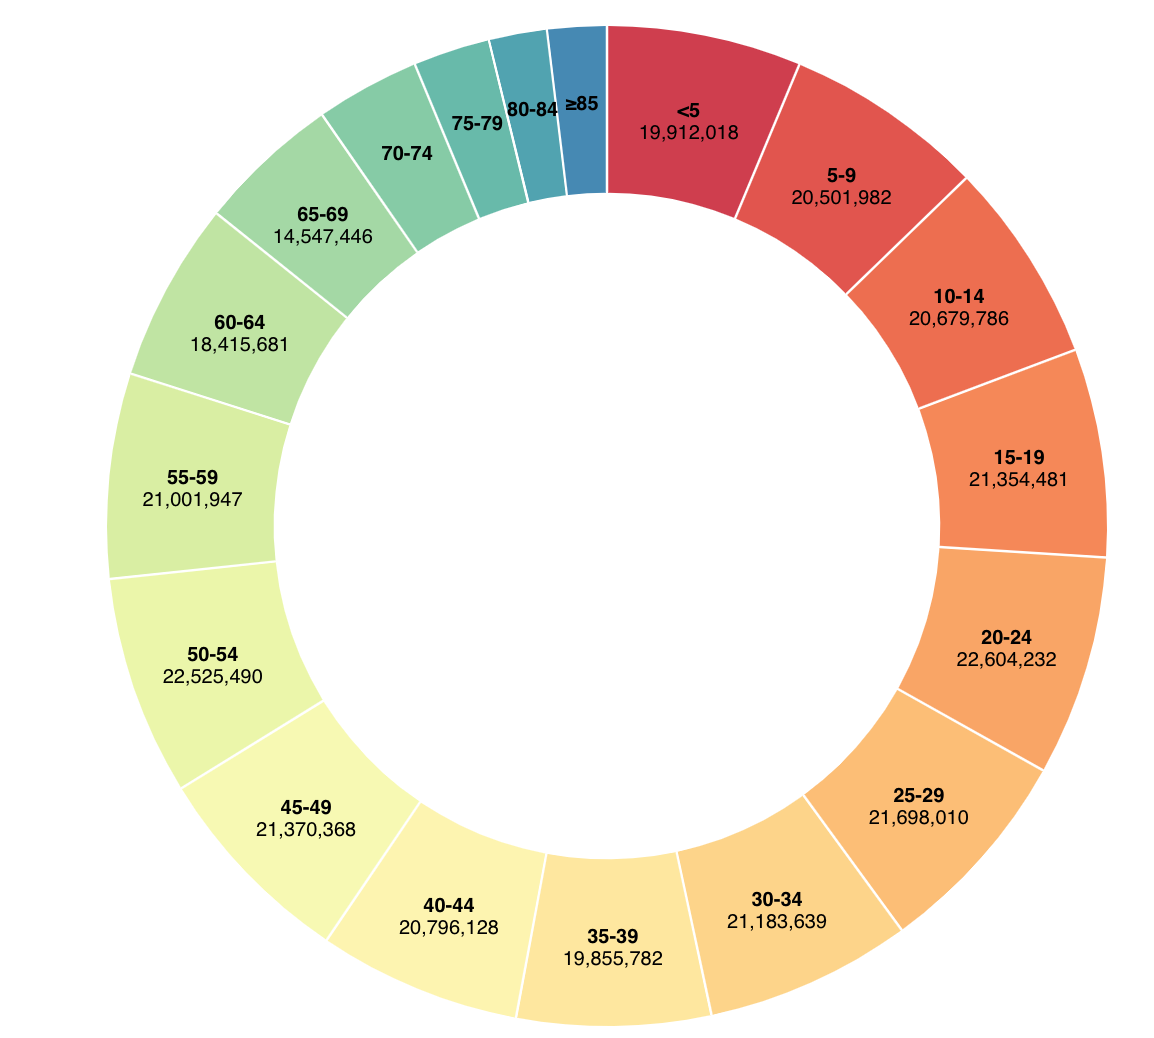 Source: https://observablehq.com/@d3/donut-chart
But that’s basic. Here’s another idea for displaying pool groups based on size and color. Getting better?
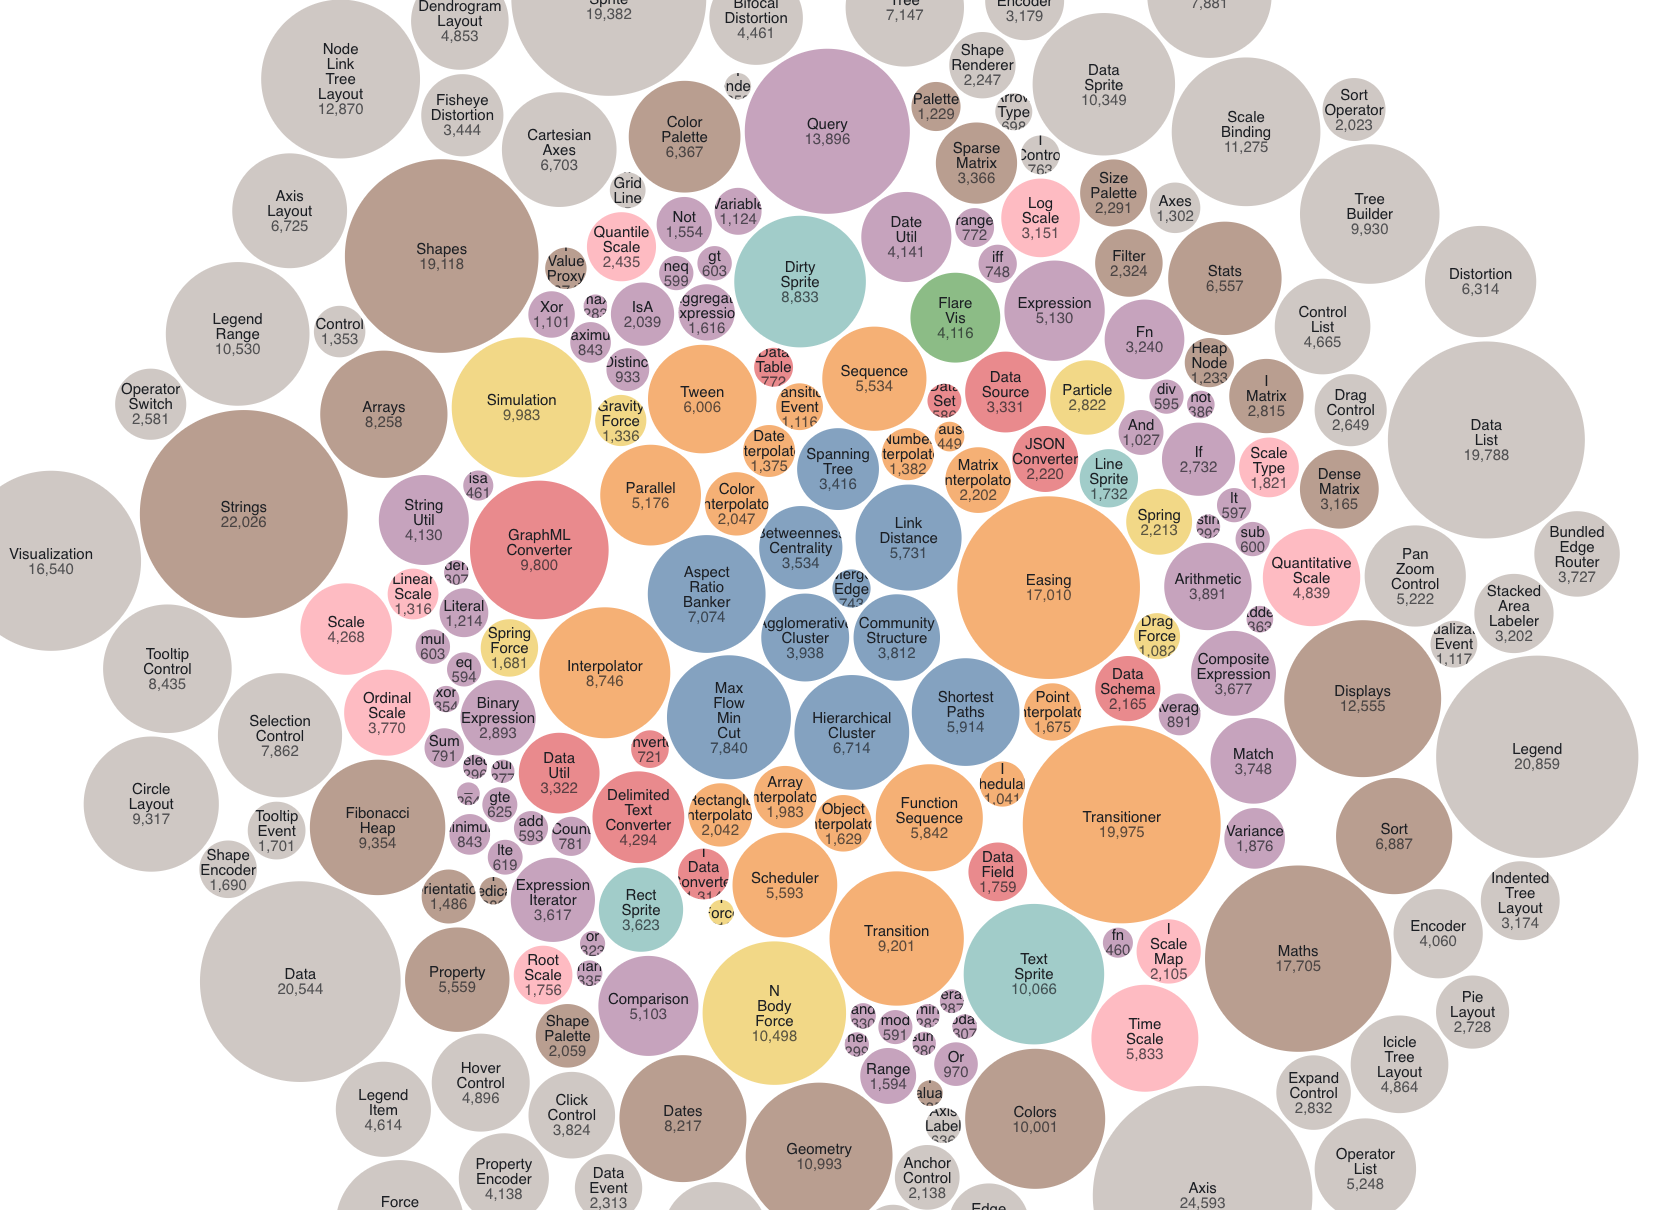 Source: https://observablehq.com/@d3/bubble-chart
Here’s an even better chart of potential pool grouping heirarchy, groups within groups (like an exchange group, analytics group, community service group of pools, etc). Would you be curious to see how the bubbles expand over time? What’s the trend? Is the exchange pool group cell metastasizing?
 Source: https://observablehq.com/@d3/pack
Finally, for real dreamfuel, checkout Mattias Stahl, one of the creaters of Svelt, presenting some of his professional data visualization storytelling work! Look at how much distill information is presented in highly crisp charts.
We encourage you to explore the D3 Examples and dream of what’s possible next. Cheers!
Sincerely,
- The BALANCE Team
If you would like to support future research and blockchain analytics, please consider delegating to Balance Stake Pool - [BALNC].
Join the BALANCE Matrix server to get involved and meet the team. Stop by today to help build a more resilient blockchain network.
Join BALANCE Matrix Server